

Mortality in the United States, 2022
By Kenneth D. Kochanek, M.A., Sherry L. Murphy, B.S., Jiaquan Xu, M.D., and Elizabeth Arias, Ph.D.
March 2024
 Key findings
Data from the National Vital Statistics System
Life expectancy for the U.S. population in 2022 was 77.5 years, an increase of 1.1 years from 2021.
- The age-adjusted death rate decreased by 9.2% from 879.7 deaths per 100,000 standard population in 2021 to 798.8 in 2022.
- Age-specific death rates increased from 2021 to 2022 for age groups 1–4 and 5–14 years and decreased for all age groups 15 years and older.
- The 10 leading causes of death in 2022 remained the same as in 2021, although some causes changed ranks. Heart disease and cancer remained the top 2 leading causes in 2022.
- The infant mortality rate was 560.4 infant deaths per 100,000 live births in 2022, an increase of 3.1% from the rate in 2021 (543.6).
This report presents final 2022 U.S. mortality data on deaths and death rates by demographic and medical characteristics. These data provide information on mortality patterns among U.S. residents by variables such as sex, age, race and Hispanic origin, and cause of death. Life expectancy estimates, age-adjusted death rates, age-specific death rates, the 10 leading causes of death, infant mortality rates, and the 10 leading causes of infant death were analyzed by comparing 2022 and 2021 final data (1).
Keywords: life expectancy, leading cause, National Vital Statistics System
How long can we expect to live?
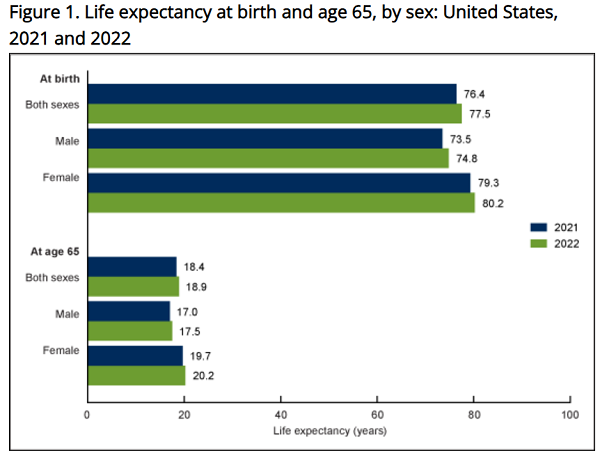
In 2022, life expectancy at birth was 77.5 years for the total U.S. population—an increase of 1.1 years from 76.4 years in 2021 (Figure 1). For males, life expectancy increased 1.3 years from 73.5 in 2021 to 74.8 in 2022. For females, life expectancy increased 0.9 year from 79.3 in 2021 to 80.2 in 2022.
In 2022, the difference in life expectancy between females and males was 5.4 years, a decrease of 0.4 year from 2021.
In 2022, life expectancy at age 65 for the total population was 18.9 years, an increase of 0.5 year from 2021. For males, life expectancy at age 65 increased 0.5 year from 17.0 in 2021 to 17.5 in 2022. For females, life expectancy at age 65 increased 0.5 year from 19.7 in 2021 to 20.2 in 2022. The difference in life expectancy at age 65 between females and males was 2.7 years in 2022, unchanged from 2021.
Note: Access data table for Figure 1.
SOURCE: National Center for Health Statistics, National Vital Statistics System, mortality data file.
What are the age-adjusted death rates for race-ethnicity-sex groups?
The age-adjusted death rate for the total population decreased 9.2% from 879.7 deaths per 100,000 U.S. standard population in 2021 to 798.8 in 2022 (Figure 2).
From 2021 to 2022, age-adjusted death rates, corrected for race and ethnicity misclassification, decreased 15.4% for Hispanic males (915.6 to 774.2) and 14.5% for Hispanic females (599.8 to 512.9). Among the non-Hispanic population, death rates decreased 15.9% for American Indian and Alaska Native males (1,717.5 to 1,444.1), 14.0% for American Indian and Alaska Native females (1,236.6 to 1,063.6), 9.7% for Asian males (578.1 to 522.2), 9.3% for Asian females (391.1 to 354.9), 8.5% for Black males (1,380.2 to 1,263.3), 11.8% for Black females (921.9 to 813.2), 7.9% for White males (1,055.3 to 971.9), and 7.8% for White females (750.6 to 691.9).
NOTES: AIAN is American Indian and Alaska Native. Race groups are single race. Data by race and Hispanic origin are adjusted for race and Hispanic-origin misclassification on death certificates. Adjusted data might differ from data shown in other reports that have not been adjusted for misclassification. Access data table for Figure 2.
SOURCE: National Center for Health Statistics, National Vital Statistics System, mortality data file.
Did age-specific death rates in 2022 change from 2021 for those age 1 year and older?
From 2021 to 2022, death rates increased 12.0% for age group 1–4 (from 25.0 deaths per 100,000 population in 2021 to 28.0 in 2022) and increased 7.0% for age group 5–14 (14.3 to 15.3) (Figure 3).
Age-specific rates decreased 10.6% for age group 15–24 (88.9 to 79.5), 9.6% for 25–34 (180.8 to 163.4), 11.3% for 35–44 (287.9 to 255.4), 14.6% for 45–54 (531.0 to 453.3), 11.2% for 55–64 (1,117.1 to 992.1), 8.0% for 65–74 (2,151.3 to 1,978.7), 8.0% for 75–84 (5,119.4 to 4,708.2), and 8.6% for 85 and older (15,743.3 to 14,389.6).
NOTES: Rates are plotted on a logarithmic scale. Data table for Figure 3 includes the number of deaths. Access data table for Figure 3.
SOURCE: National Center for Health Statistics, National Vital Statistics System, mortality data file.
What are the death rates for the 10 leading causes of death?
In 2022, the 10 leading causes of death remained the same as in 2021. The top leading cause in 2022 was heart disease, followed by cancer (Figure 4).
Four causes changed rank from 2021. Unintentional injuries, the 4th leading cause of death in 2021, became the 3rd leading cause in 2022, while COVID-19 dropped from the 3rd leading cause to the 4th. Kidney disease went from the 10th leading cause in 2021 to the 9th leading cause in 2022, while Chronic liver disease and cirrhosis dropped from the 9th leading cause to the 10th. The remaining leading causes in 2022 (stroke, chronic lower respiratory diseases, Alzheimer disease, and diabetes) remained at the same ranks as in 2021.
From 2021 to 2022, age-adjusted death rates decreased for 9 of the 10 leading causes of death and increased for 1. The rate decreased…
[READ THE COMPLETE ARTICLE HERE]